Welcome to evogeneao.com!
Our mission is to promote the teaching of evolution by emphasizing its greatest lesson: LIFE ON EARTH IS ONE BIG EXTENDED FAMILY! Every human being is related genealogically not just to all other humans, but to all other living things. And not only organisms living today, but to everything that has ever lived. This view of life can be thought of as 'Evolutionary Genealogy'. Evogeneao (pronounced "ee-voh-gee-nee-oh") is a play on this term.
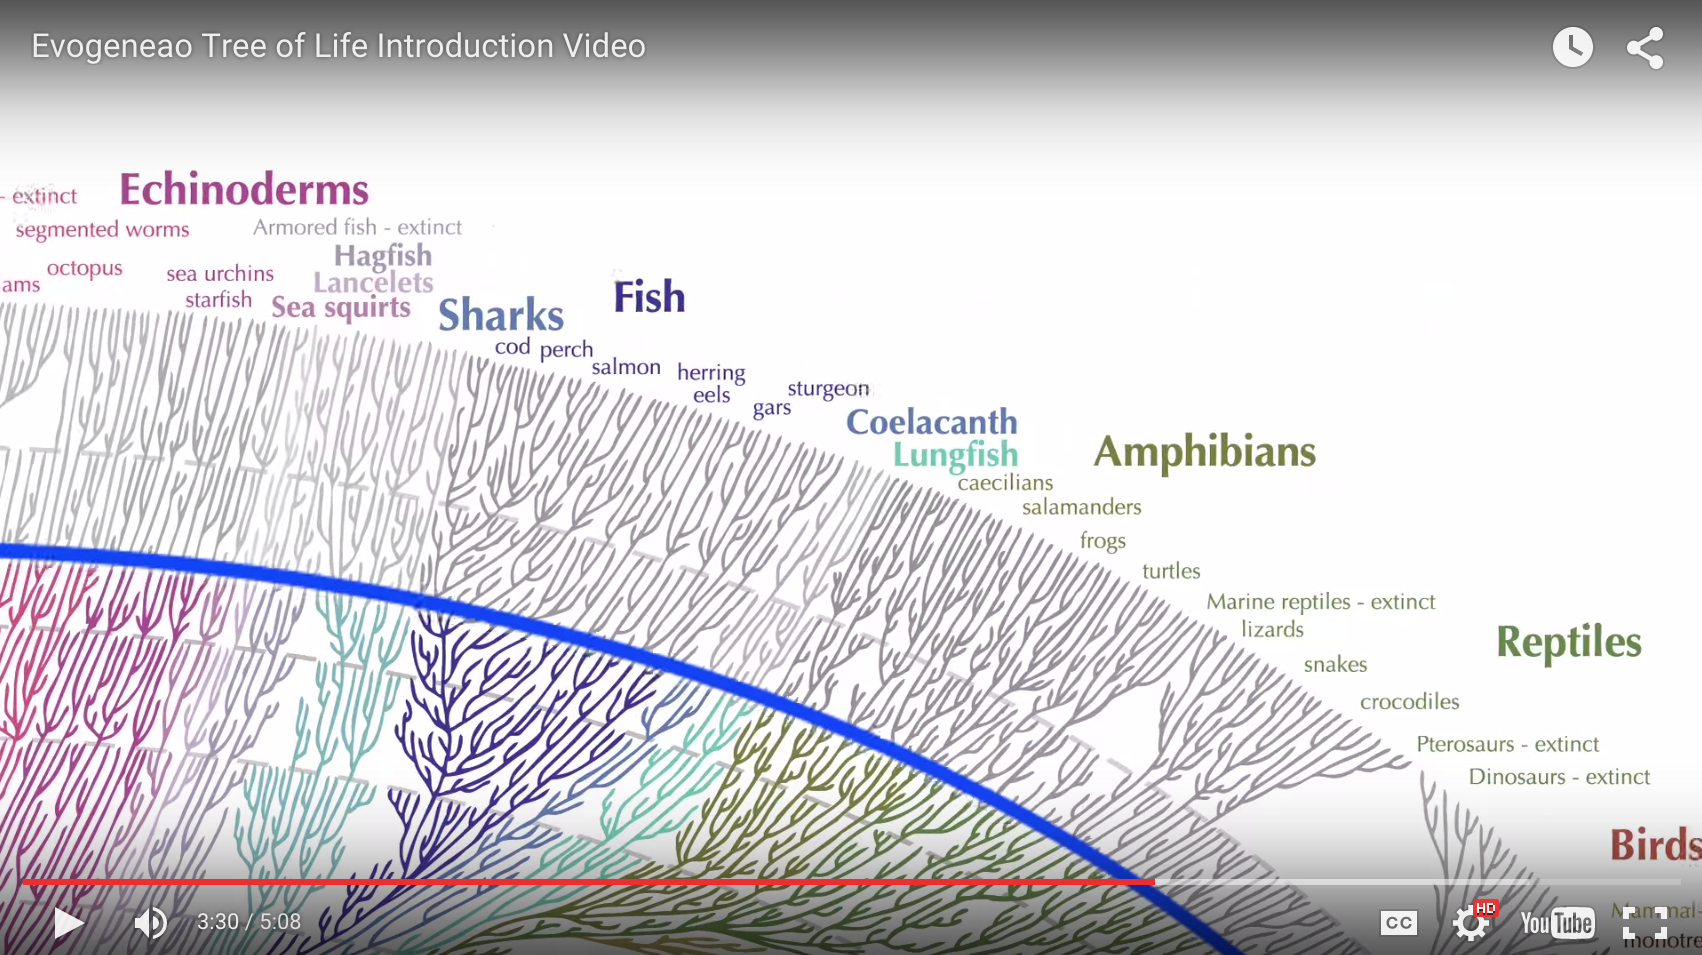
The Tree of Life
To illustrate evolution we use the Evogeneao Tree of Life diagram and cousin and removal relationships with other living things.

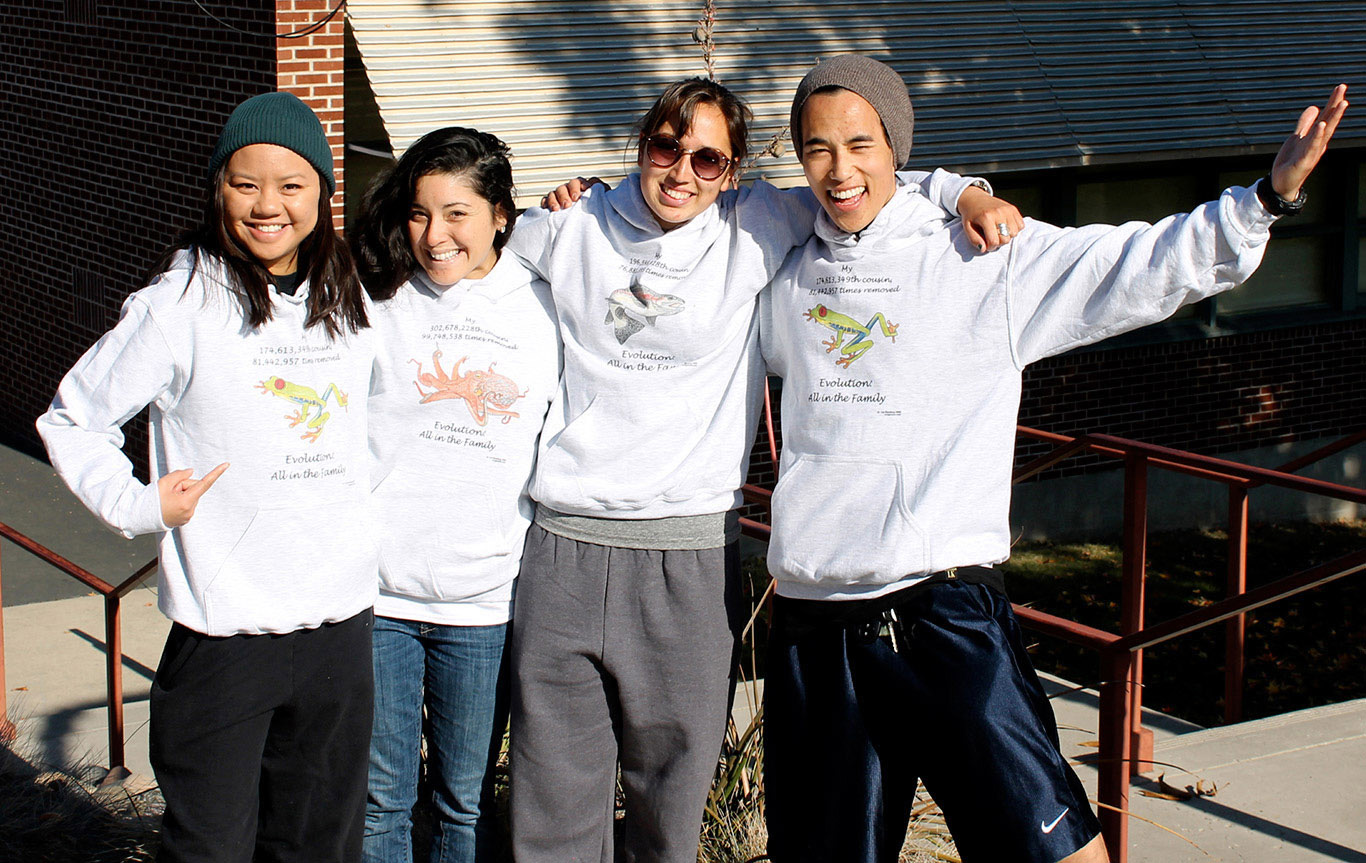
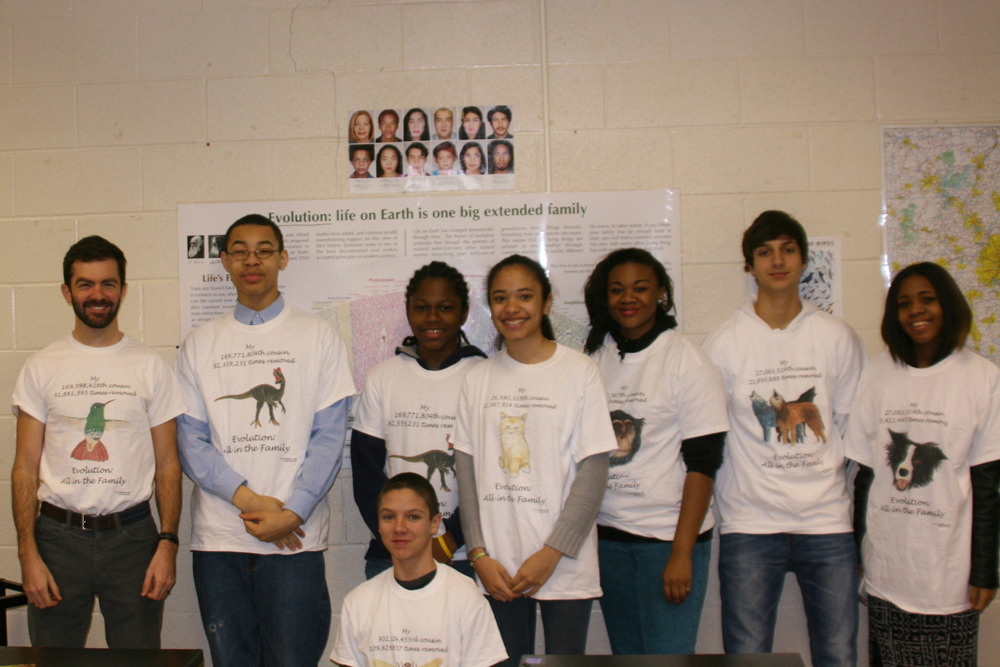
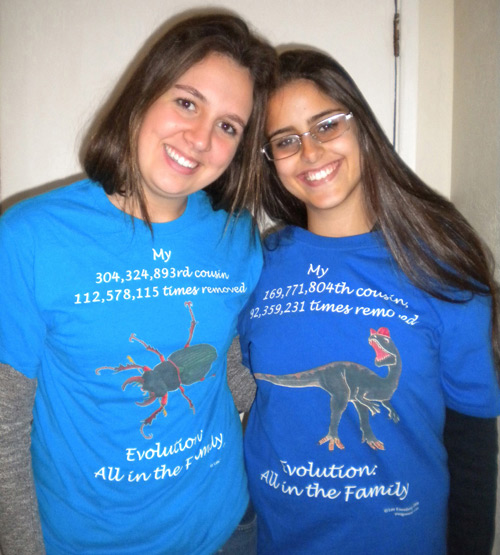
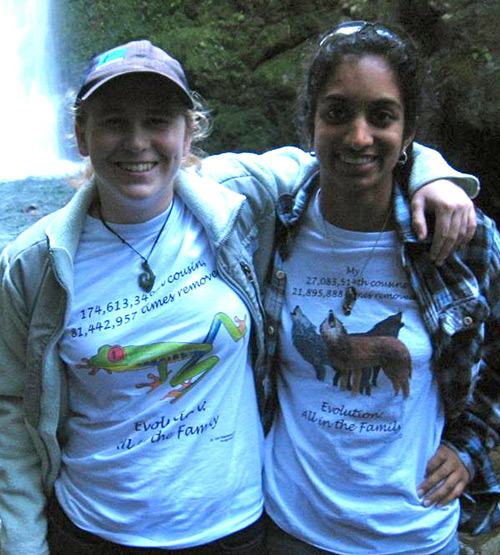
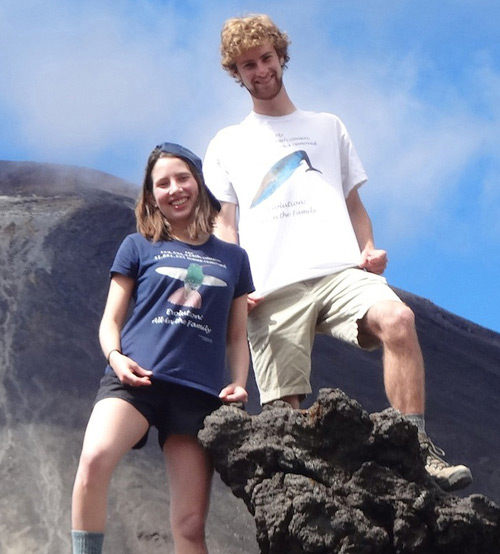
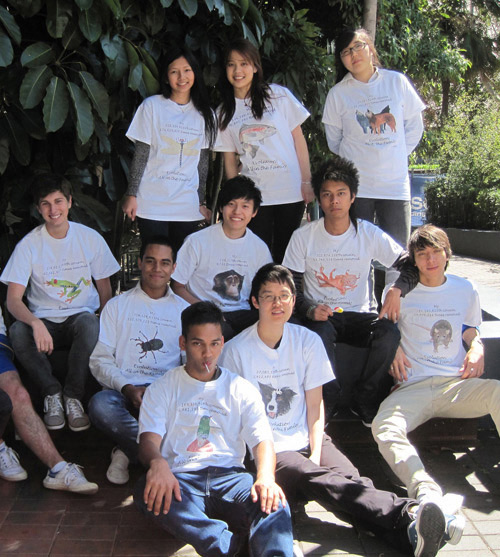
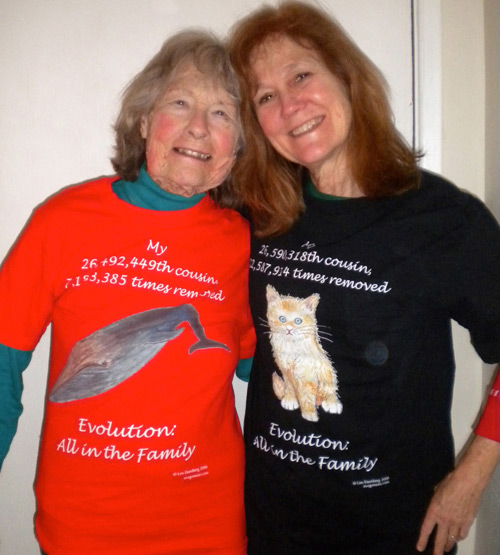
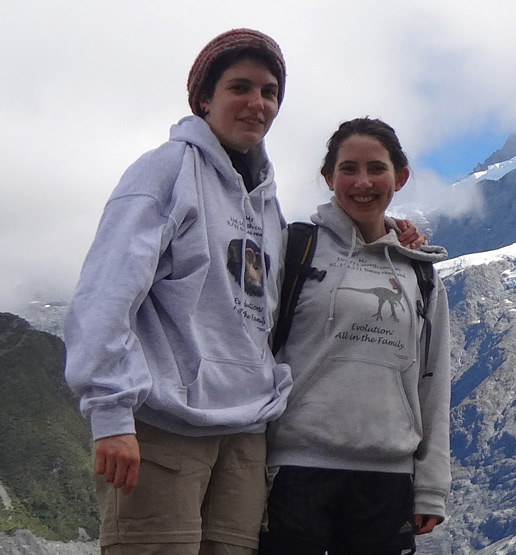
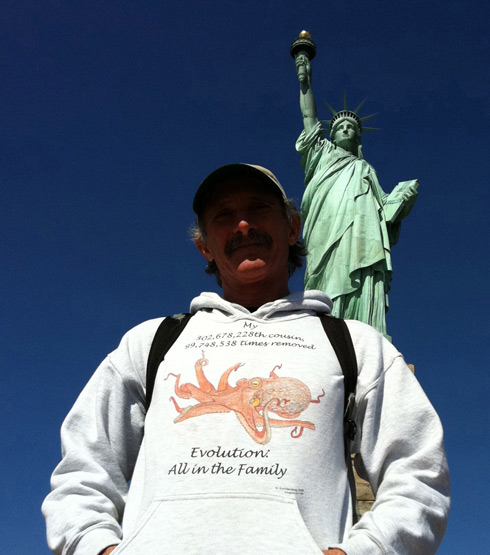
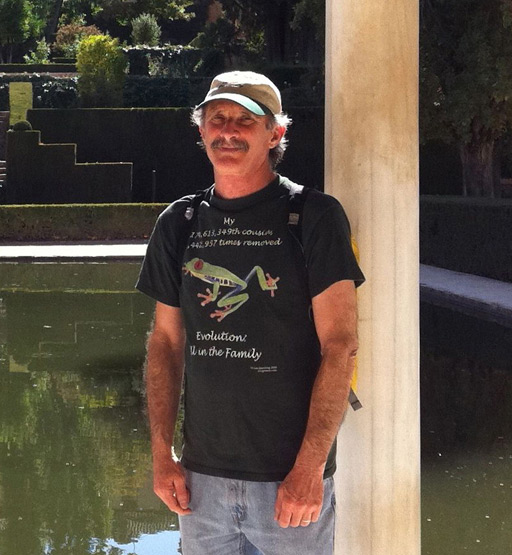
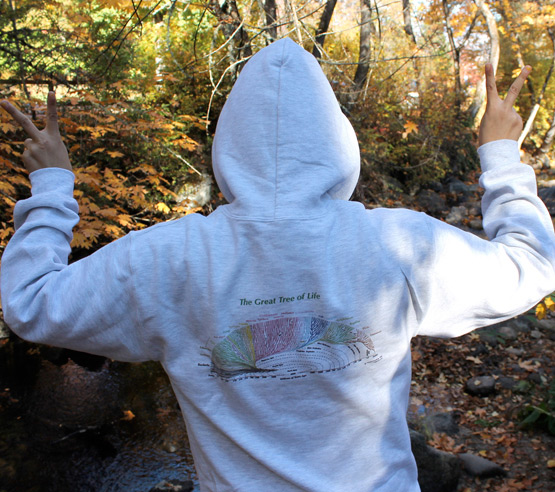
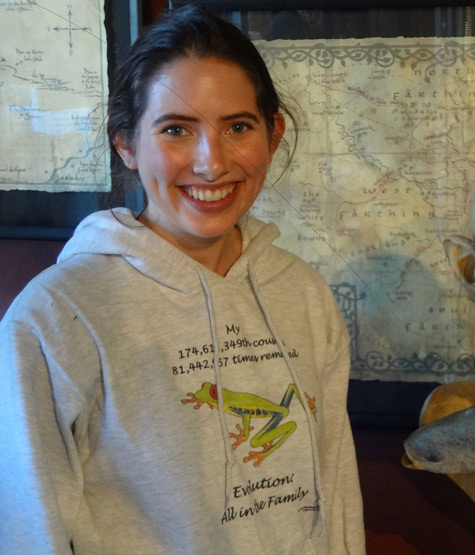
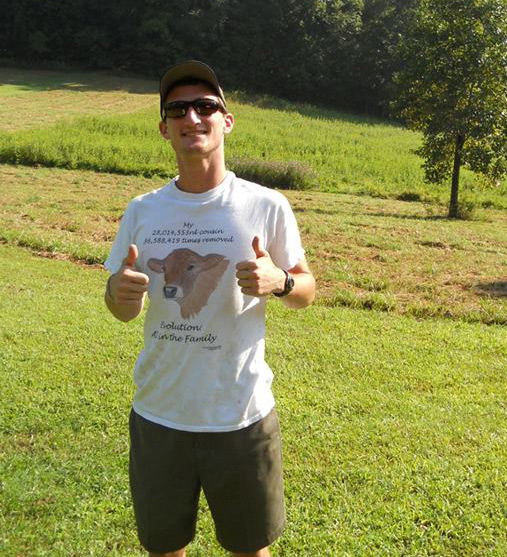
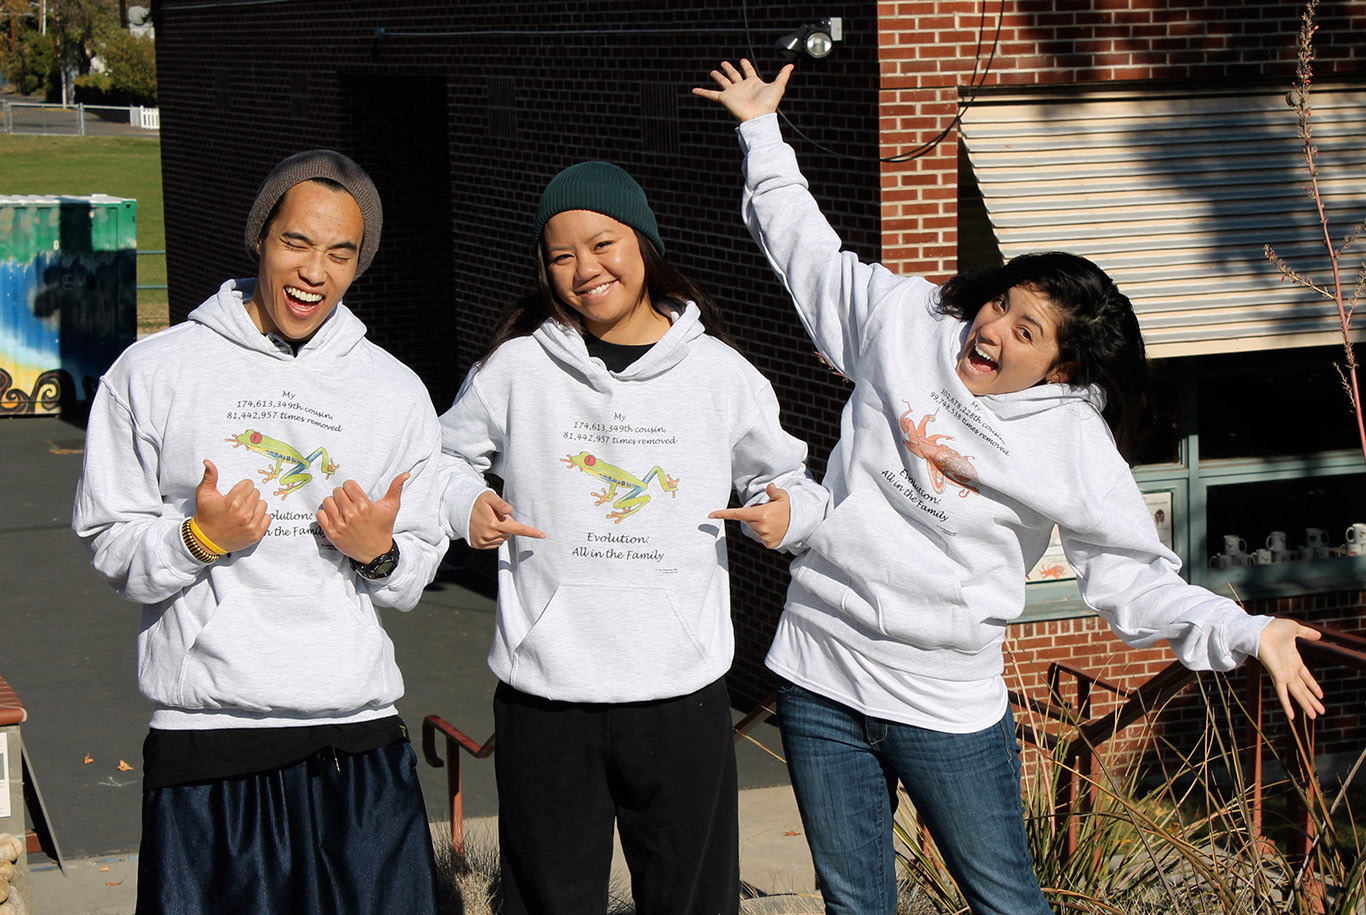
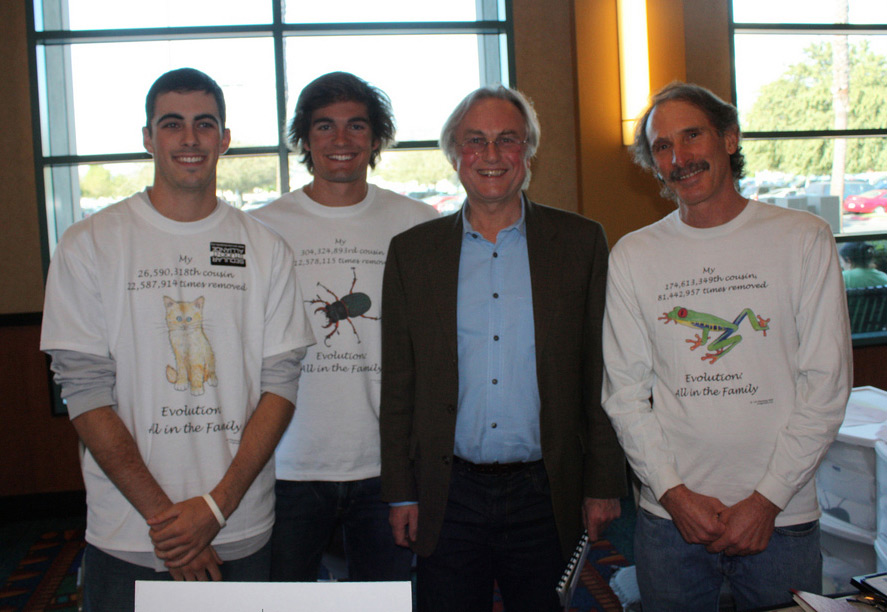
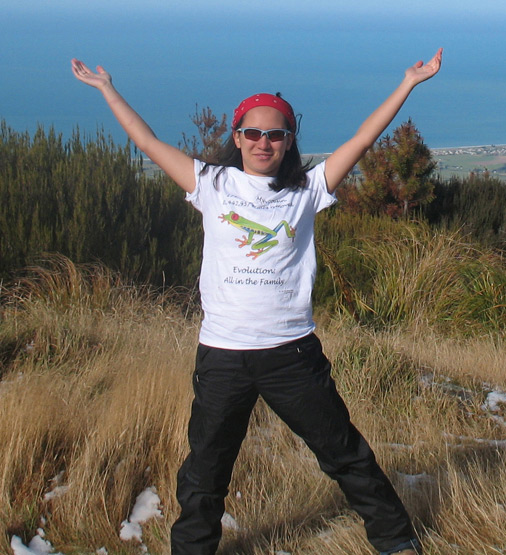
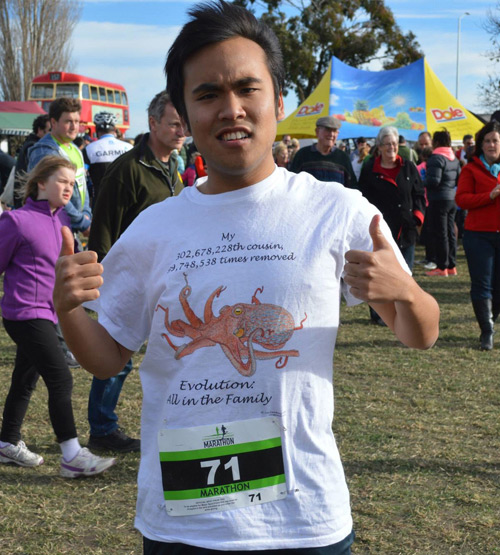
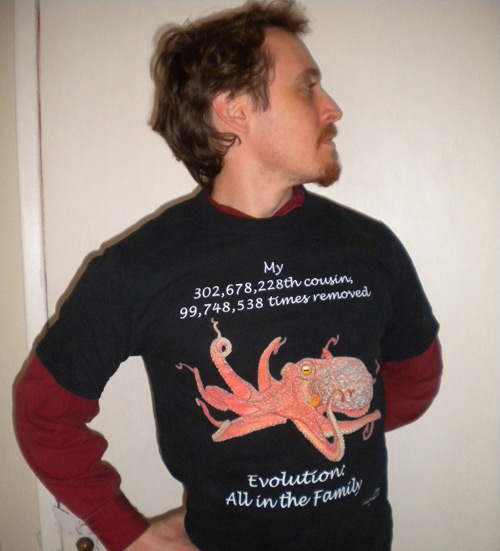
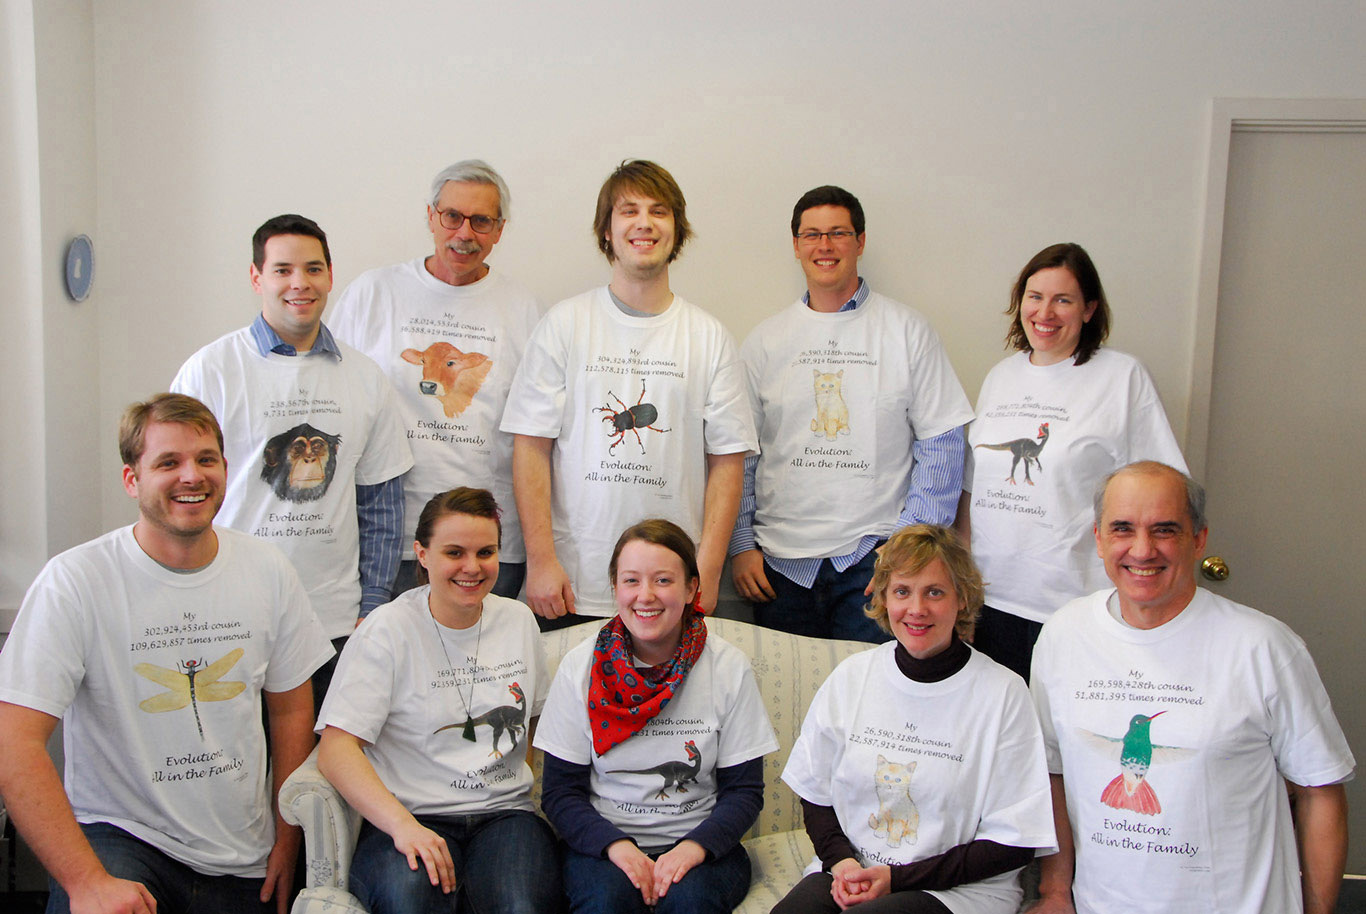
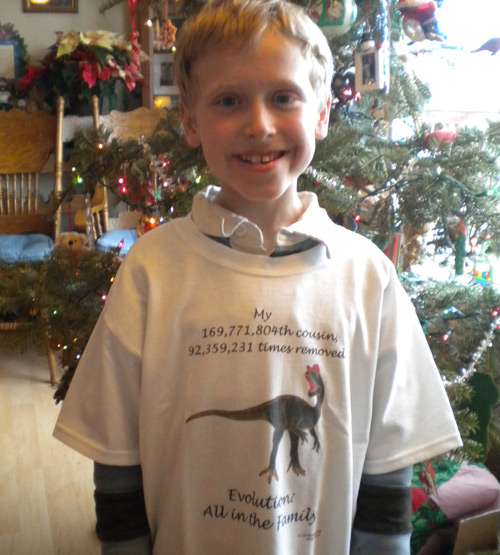
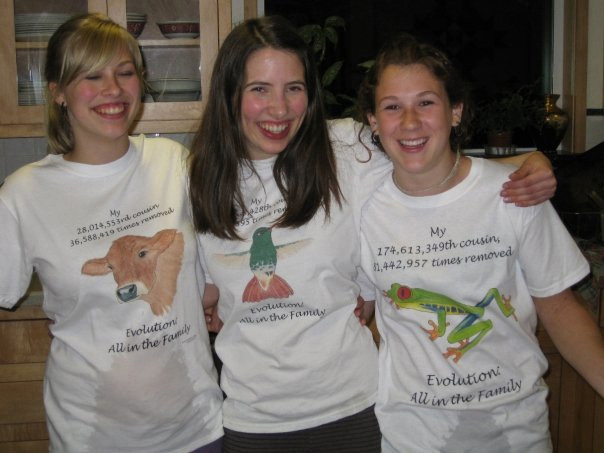
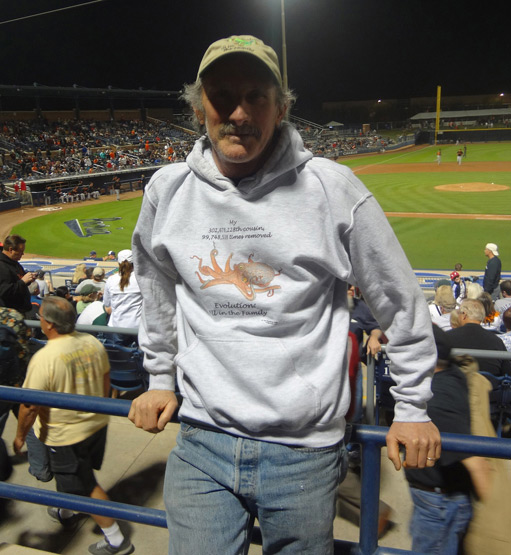
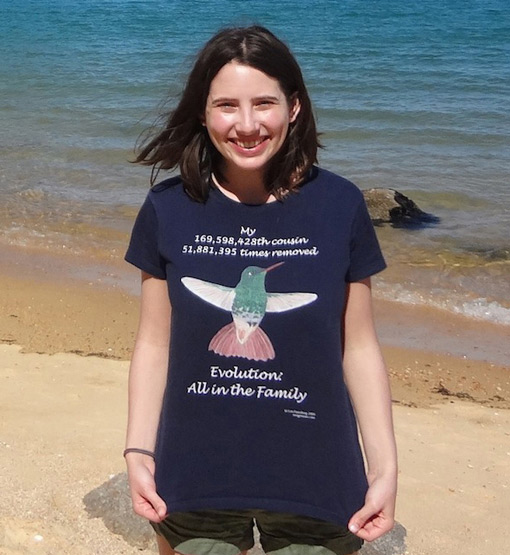
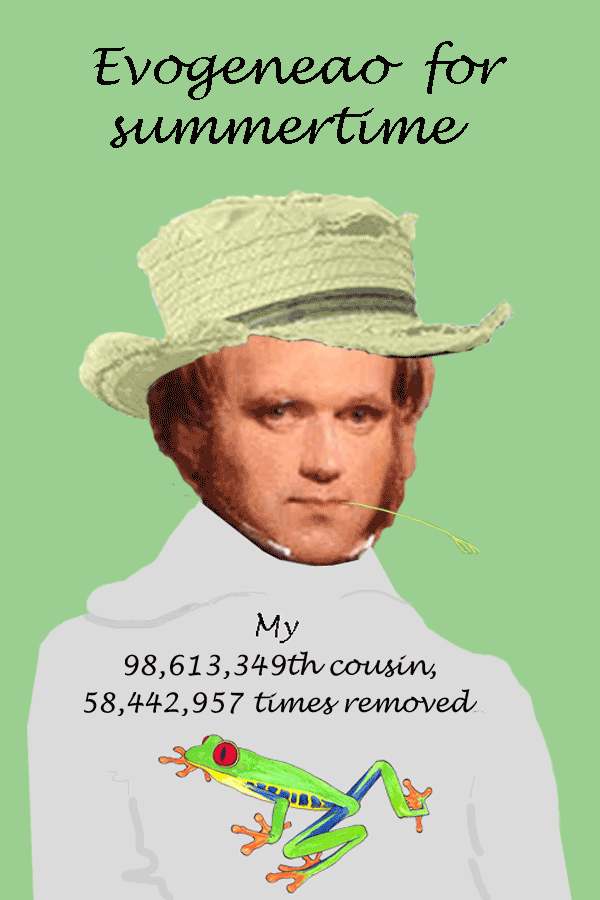
The Evogeneao Tree of Life is a colorful family tree that helps students understand evolution at a glance. Cousin and removal estimates make the evolution connection fun and personal. The Evogeneao Tree of Life is the centerpiece of two educational posters, available in our shop, along with tee shirts, hoodies, and other garments which feature cousin and removal estimates and original artwork. Evogeneao products and techniques have helped teachers worldwide teach the fundamentals of evolution in the classroom.
The Evogeneao Tree of Life diagram shows all the major and some of the minor branches of life tied to a geologic time scale, all in the colorful shape of a living tree. It also shows some major branches of life that have gone extinct, and hints at changes in diversity through time, especially at mass extinctions. Evogeneao numerical estimates of cousin and removal relationships are made by counting generations along lines of descent back to common ancestors.

Life of Earth is One Big Extended Family
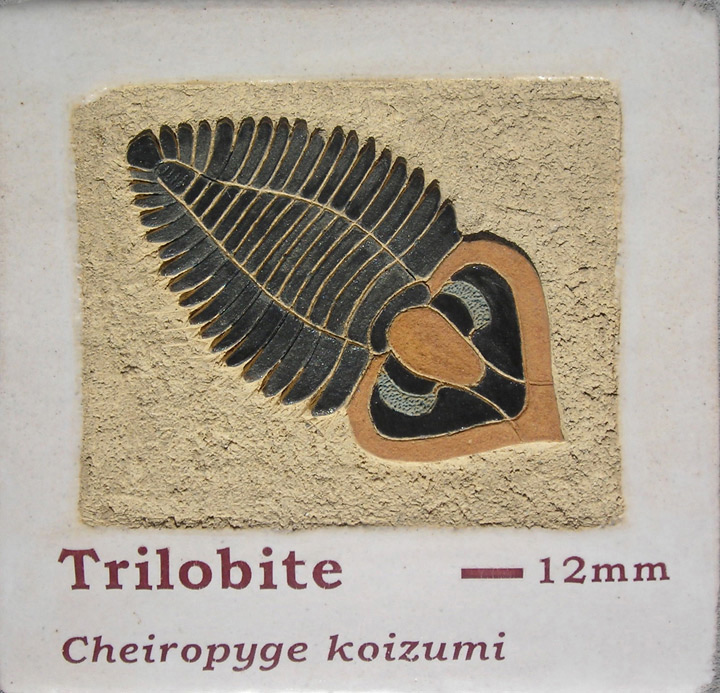
View the full set of plate tectonic maps and ancient animal tiles at Briscoe Geology Park in Ashland, Oregon.
Biological evolution is one of the three most profound discoveries in science. The other two are the vastness of the universe and the depth of geologic time. As such, these three discoveries should be the foundation of all science learning.
If the typical fourth grader can name planets in their order from the sun, she should also know that life is all related by descent from common ancestors. Life on Earth is One Big Extended Family.